Where Are Humpback Whales Seen Most in Samaná Bay?
Samaná Bay in the Dominican Republic is well known for its seasonal humpback whale activity. During the breeding season, whales may be observed traveling, surfacing, interacting, and caring for their calves in different parts of the surrounding waters.
But are some areas used more frequently than others And how can scientists determine whether a location is genuinely important to whales rather than simply easier for observers to survey?
Researchers investigate these questions by recording whale sightings, mapping geographic coordinates, comparing observations across locations, and accounting for differences in survey effort. This approach helps them understand the distribution of whale activity without assuming that every sighting represents a different animal.
What Does a Frequently Used Whale Area Mean?
A frequently used whale area is a location where observations repeatedly document whale activity over a defined period.
Researchers may identify such areas by analyzing the locations of sightings collected during multiple surveys. Depending on the study, they might examine all whale encounters, sightings of identified individuals, or particular behaviors such as traveling or mother-calf interactions.
However, frequent sightings do not automatically prove that a location is the most important habitat for humpback whales.
An area may produce many sightings because researchers visit it often, boats commonly travel through it, or whales are easier to observe there. Scientists must consider these possibilities before interpreting the results.
A reliable analysis distinguishes between the number of observations, the number of individual whales, and the amount of time or effort spent searching each location.
How Do Scientists Map Humpback Whale Sightings?
Researchers can record the geographic coordinates of whale encounters using GPS-equipped vessels or other reliable location-recording methods.
Each sighting can be stored with details such as the date, time, number of whales observed, identification information, and behavior.
When plotted on a map, these records reveal where observations occurred. Researchers can then compare locations and look for repeated concentrations of sightings.
For example, a map might show several observations in one section of the bay and fewer in another. That pattern can help researchers decide where to investigate further.
The map alone does not explain why the difference exists. Scientists must examine survey coverage, environmental conditions, and other relevant factors before drawing conclusions about habitat use.
Why Is Survey Effort Important?
Survey effort is one of the most important considerations when comparing whale sightings.
Imagine that researchers spend ten days observing one area but only two days surveying another. The first area could produce more sightings simply because it received more observation time.
To make a fair comparison, scientists may record how long surveys lasted, how far observers traveled, which locations were covered, and whether conditions allowed whales to be detected.
Depending on the study design, they may compare sightings per unit of search effort or use statistical models that account for differences in observation and detection.
These adjustments help reduce the risk of confusing high survey activity with high whale activity.
Even after adjustment, researchers must interpret the results carefully because sea conditions, whale behavior, and the quality of observations can still affect detection.
Do More Sightings Mean More Whales?
Not necessarily.
One humpback whale may be observed multiple times during the same survey or on different days. If researchers count every encounter as a separate animal, the total number of sightings can exceed the number of individuals.
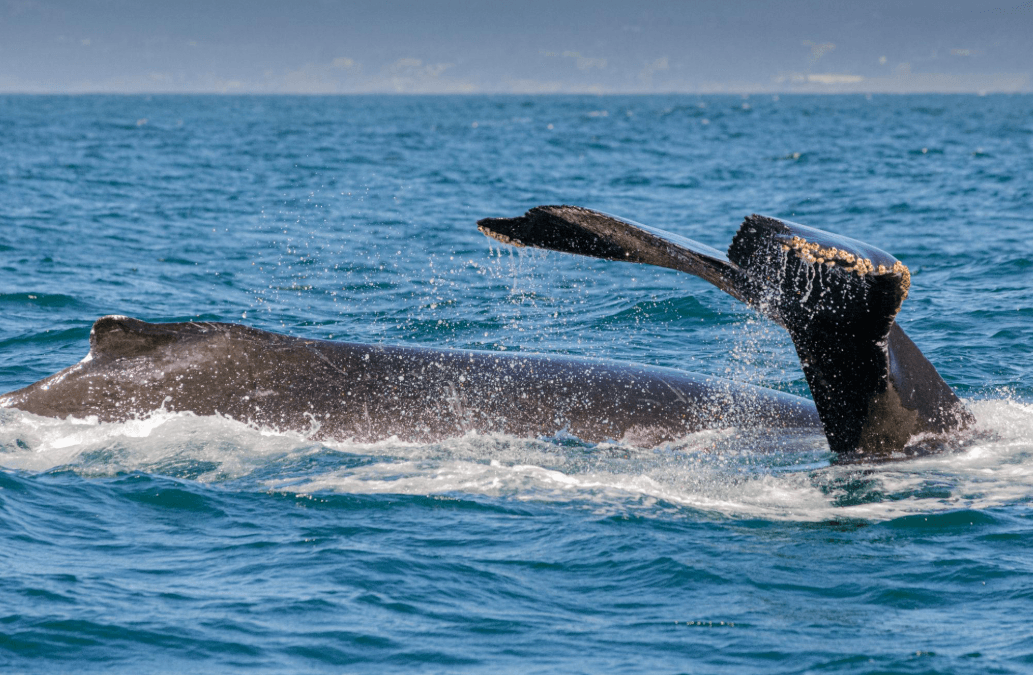
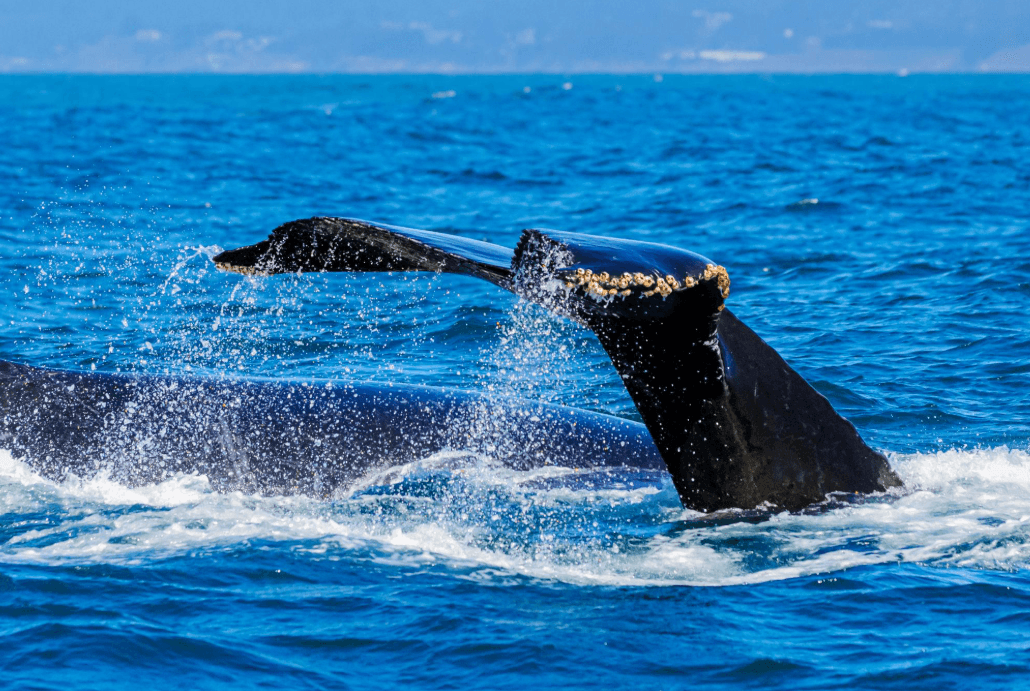
Photo identification can help address this problem. By comparing distinctive tail-fluke markings and other identifying features, researchers may determine whether different records involve the same whale.
Scientists can then analyze several different measures:
- Total sightings: How many whale encounters were recorded.
- Identified individuals: How many distinct whales were reliably recognized.
- Encounter frequency: How often whales were observed relative to survey effort.
- Spatial distribution: How observations were spread across the study area.
Each measure answers a different question. Together, they provide a more complete picture of whale activity.
Can Scientists Identify Hotspots of Whale Activity?
Yes. Spatial analysis can help researchers identify areas with relatively high concentrations of whale observations.
One approach is to map sightings and look for locations where observations cluster. More advanced analyses may use spatial density methods or statistical models to compare the distribution of sightings across a defined area.
Researchers must choose an appropriate geographic scale. A cluster visible on a detailed map may look different when the same data are grouped into larger sections of the bay.
The results also depend on the dates included in the analysis. A location with many sightings during one week may not show the same pattern throughout the entire breeding season.
For this reason, researchers should define the study period, explain how observations were collected, and avoid presenting a temporary concentration as a permanent whale hotspot.
What Can Cause Whale Sightings to Differ Between Locations?
Several factors may contribute to differences in observed whale distribution.
Habitat characteristics: Water depth, coastal geography, and other environmental features may influence how whales use different areas.
Whale behavior: Traveling whales, mothers with calves, and individuals engaged in social interactions may use space differently.
Seasonal changes: The distribution of whale observations may change as animals arrive, move through the region, and eventually depart.
Environmental conditions: Visibility, sea state, and weather can affect whether observers detect whales.
Human observation patterns: Research vessels and whale-watching boats may cover some routes more frequently than others.
These factors can interact, making it difficult to attribute a concentration of sightings to a single cause. Scientists need suitable data to determine which explanations are supported.
How Do Researchers Compare Different Parts of Samaná Bay?
Researchers can divide a study area into geographic sections or use mapped observation coordinates to compare whale encounters.
For each section, they may examine the number of sightings, the frequency of encounters, the identities of observed whales, and the amount of survey effort.
They can then investigate whether observed differences remain after accounting for factors that influence detection.
For example, if one area continues to show a higher encounter rate after researchers account for survey effort, the finding may suggest that whales use that area more frequently during the period studied.
It would still be necessary to consider the limits of the data before describing the area as consistently important across different years or seasons.
Importantly, this analysis should rely on actual observation records. Without verified location data, it would be misleading to name a specific part of Samaná Bay as the most frequently used whale area.
Can Whale Distribution Maps Help Conservation?
Yes. Maps showing repeated whale observations can help researchers understand how animals use a region and identify locations that may deserve additional monitoring.
When combined with information about habitat characteristics, human activity, and whale behavior, distribution data can contribute to conservation planning.
For example, reliable evidence of repeated whale use in a particular area may help inform discussions about responsible vessel operations, monitoring priorities, or the management of human activities.
However, a sighting map is not sufficient by itself to establish a conservation boundary or determine the ecological importance of a location. Those decisions require appropriate scientific evidence and consideration of relevant regulations and management objectives.
Researchers must also update their understanding as new observations become available.
What Can Whale Watchers Learn From These Studies?
Whale watchers can learn that seeing a whale is part of a larger pattern of animal movement and habitat use.
Repeated observations may help scientists understand where whales are commonly encountered, but they cannot guarantee where a whale will appear during an individual trip.
Whales move independently, spend time underwater, and may use different parts of the bay as conditions and behavior change.
Visitors should choose responsible tour operators who follow applicable wildlife-viewing rules, maintain appropriate distances, and prioritize the animals' welfare over obtaining a close encounter.
Understanding whale distribution also encourages visitors to appreciate the bay as a complex marine habitat rather than treating sightings as predictable events.
Frequently Asked Questions
Where are humpback whales seen most often in Samaná Bay?
The answer depends on the period studied, the observation records available, and how researchers account for survey effort. Reliable location data are needed before naming a particular area as the most frequently used.
Do frequent whale sightings mean an area has more whales?
Not necessarily. Frequent observations may reflect repeat encounters with the same individuals or greater survey effort. Scientists use identification records and appropriate analysis to distinguish these possibilities.
How do researchers create whale distribution maps?
They record the locations of whale encounters and plot the observations geographically. They may then use spatial analysis to identify concentrations and compare encounter rates between areas.
Why do scientists record survey effort?
Survey effort helps researchers account for differences in how often and how extensively locations are searched. Without it, areas visited more frequently may appear to have more whales simply because observers spend more time there.
Can whale hotspots change during the season?
Yes. The distribution of sightings may vary over time as whales move through the region and environmental or observation conditions change. Researchers need dated observations to investigate these patterns.
Can tourists use sighting maps to guarantee a whale encounter?
No. Sighting maps can provide information about recorded observations, but they cannot predict the exact location of a wild whale during a future trip. Wildlife sightings remain uncertain.
Conclusion
Scientists identify frequently used humpback whale areas in Samaná Bay by combining geographic sighting records, individual identification, survey-effort information, and spatial analysis.
The most important step is distinguishing genuine patterns of whale activity from differences caused by observation methods. A location with many recorded sightings may be important to whales, but it may also receive more survey effort or offer better viewing conditions.
With consistent records and careful analysis, researchers can build a more reliable picture of how humpback whales use different parts of the bay. This information supports marine research, responsible whale watching, and informed conservation planning in the Dominican Republic.

Local explorer & expert guide in Samana Whale Watching Tour.